This post continues my discussion of how to meta-analyze state polls. My most recent post was on Saturday morning. Today I’d like to focus on a particular strength of meta-analysis, its use as a precise tracking tool.
Meta-analysis of state-level polls allows one to make an estimate of where the race stands at any given moment. As a biophysicist and neuroscientist, I use simple yet powerful statistical tools that reduce the complexity of state polls to a single snapshot, the Median Electoral Vote Estimator. Its effective margin of error (MoE) is currently 35 electoral votes, equivalent to less than 1.0% in units of popular votes.
This exceptionally small MoE outperforms any other publically available measure, including fivethirtyeight.com. Poblano’s resource is valuable and fully deserving of its popularity. However, his work does contain a flaw that introduces unnecessary error - one that I fixed four years ago in 2004. My repair is available at election.princeton.edu for your use between now and November.
I’ll state at the outset that Poblano’s site is very well suited for polling junkies. First, large amounts of information are available there. Second, he makes a true projection, using cautious assumptions about what polls can tell us about an election outcome that is months away. The flaw I describe here does not take away from those merits.
The Meta-Analysis makes no attempt at a prediction. To quote Yogi Berra and Niels Bohr, "Prediction is hard, especially of the future." The Meta-Analysis, with its very small effective MoE, does give a lot of information about what is happening on a day-to-day basis.
If you have difficulty following the brief description below, I encourage you to read a popular description of how meta-analyses of the Electoral College began in 2004, and my post on Saturday.
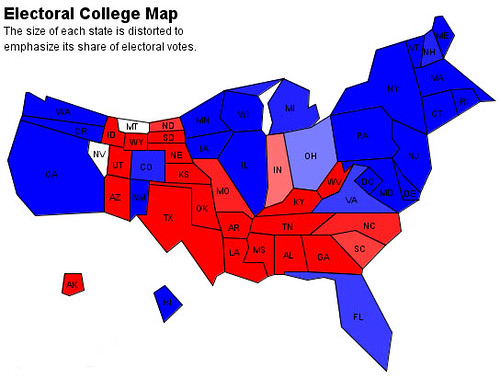
The first step in estimating Electoral College outcomes is to estimate the state-by-state win probabilities. Poblano’s approach is to use current polling information as well as a slew of other factors, including past reliability of individual pollsters and informed guesses about how much future change may occur. My approach is to take the last three polls only, giving a current snapshot. Therefore his site is future-oriented, while mine is focused on the here and now:
The second step is to combine these probabilities into an estimate of the likely overall outcome, measured in electoral votes (EV). Poblano’s approach is to carry out thousands of simulations, then tally the simulations. That method reflects the fantasy baseball tradition, in which individual outcomes are often of great interest. However, such an approach is intrinsically imprecise because it draws a finite number of times from the distribution of possible outcomes.
The Meta-Analysis calculates the probability distribution of all 2.3 quadrillion possible outcomes. This can be done very quickly by calculating the polynomial probability distribution, known to students as Pascal’s Triangle. You can read about its implementation here.
To illustrate what a difference this makes, let’s consider some recent data. Fivethirtyeight lists win probabilities for the 50 states and the District of Columbia. That site’s tabulation of 10,000 simulated outcomes looks like this:
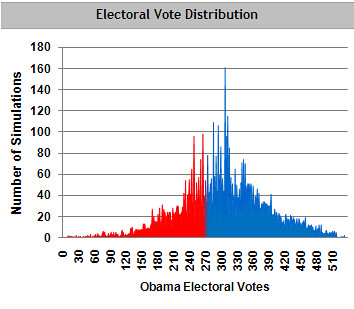
These simulations are drawn from the true distribution corresponding to fivethirtyeight's figures, which looks like this:

This true distribution takes the form of a bell-shaped curve, as expected given the large number of states and Silver’s cautious future projections. In contrast, the distribution of simulations is highly irregular, probably because of inadequate sampling. The undersampling may account for an error in his top-line EV estimate, Obama 303, McCain 235. I calculate the true estimate from his probabilities as Obama 308, McCain 230. In fact, because of the smoothness of the distribution this result could be obtained without any simulation at all, simply by adding up all the states' EV, weighted by probability. To put it bluntly, his simulations are not only imprecise but also unnecessary.
Now let’s look at today’s snapshot of polls from election.princeton.edu:
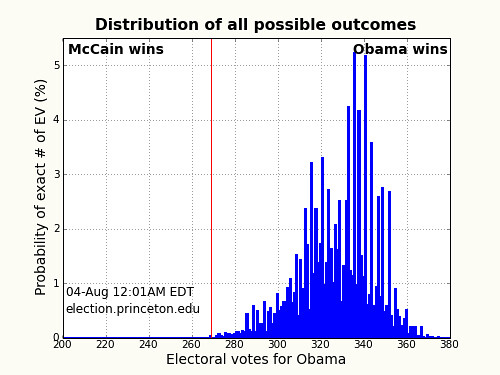
The current-poll-based distribution looks spiky because recent polls give fairly extreme single-state probabilities. For example, if the election were held today, an Obama victory in Washington state is near-certain, but in November less so because of unknown future events.
The Meta-Analysis is also precise because it uses dozens of polls from states in contention, and over 100 polls in all. Today’s Meta-Analysis gives an EV estimate of Obama 331, McCain 207, with an effective MoE of 35 EV. Using a conversion procedure that I describe here, this MoE is equivalent to a little bit less than 1.0% - better than you will find at any other resource on the 'tubes.
Such high precision is useful for tracking movement in the race from day to day. The estimator's history shows only one major swing this year: Hillary’s withdrawal in early June, which was followed by a sharp jump in Obama’s performance against McCain. No other event provided nearly as large a change. For the last three weeks there has been virtually no movement:
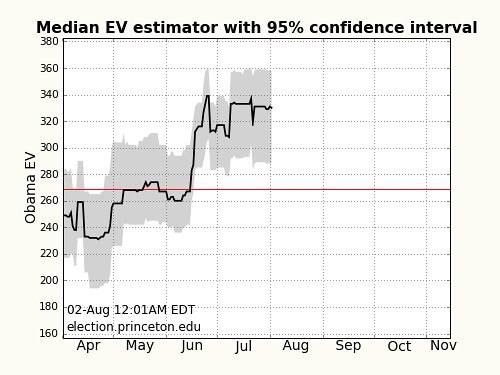
I’ll end with a caveat. Individual states are polled less frequently than the nation as a whole. Therefore the Meta-Analysis may respond more slowly to changes than national averages. But it responds far more accurately.
So - to relieve your anxiety at the vagaries of individual polls, visit election.princeton.edu.